National Popular Vote

The National Popular Vote (NPV) movement emerged in late 2006 and has slowly gained some steam since then.
NPV seeks to ensure that the presidential candidate who wins the most popular votes nationwide is elected president. When a state passes legislation to join the National Popular Vote Compact, it pledges that all of that state’s electoral votes will be given to whichever presidential candidate wins the popular vote nationwide, rather than the candidate who won the vote in just that state.
These bills will take effect only when states with a majority of the electoral votes have passed similar legislation and joined the compact. States with electoral votes totaling 270 of the 538 electoral votes would have to pass NPV bills before the compact kicks in and any state’s bill could take effect.
Agreement Among the States to Elect the President by National Popular Vote
The National Popular Vote Interstate Compact will guarantee the Presidency to the candidate who receives the most popular votes across all 50 states and the District of Columbia. The Compact ensures that every vote, in every state, will matter in every presidential election. The Compact is a state-based approach that preserves the Electoral College, state control of elections, and the power of the states to control how the President is elected.
The National Popular Vote bill has been enacted by 16 jurisdictions possessing 196 electoral votes, including 4 small states (DE, HI, RI, VT), 8 medium-sized states (CO, CT, MD, MA, NJ, NM, OR, WA), 3 big states (CA, IL, NY), and the District of Columbia. The bill will take effect when enacted by states with 74 more electoral votes. The bill has passed at least one chamber in 8 additional states with 75 more electoral votes (AR, AZ, ME, MI, MN, NC, NV, OK). A total of 3,408 state legislators from all 50 states have endorsed it.
The shortcomings of the current system of electing the President stem from “winner-take-all” laws that have been enacted by state legislatures in 48 states. These laws award all of a state’s electoral votes to the candidate receiving the most popular votes in each state.
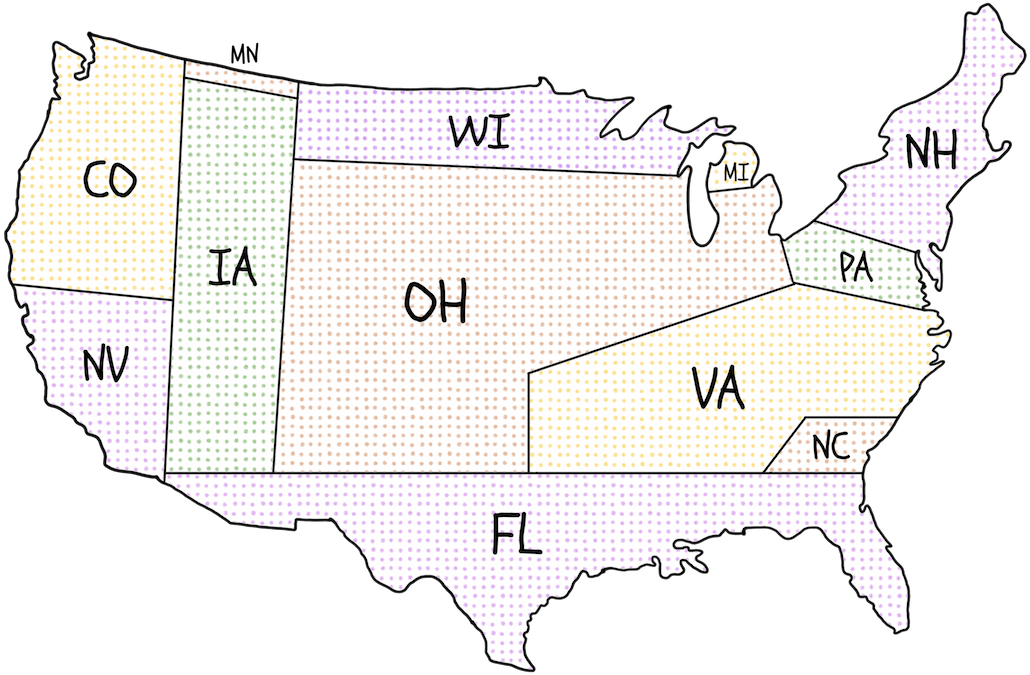
Because of these state winner-take-all statutes, presidential candidates have no reason to pay attention to the issues of concern to voters in states where the statewide outcome is a foregone conclusion. In 2012, as shown on the map, all of the 253 general-election campaign events were in just 12 states, and two-thirds were in just 4 states (Ohio, Florida, Virginia, and Iowa). Thirty-eight states were completely ignored.
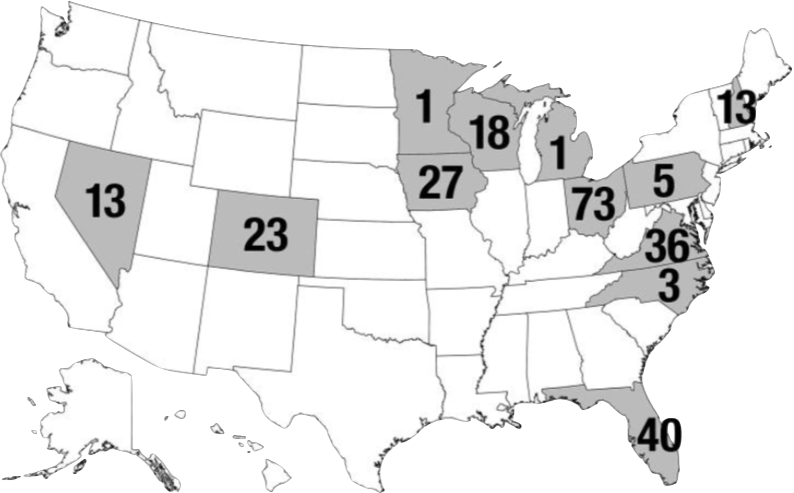
Here’s a map of US with state sizes based on the number of campaign events in 2012. This is how the candidates view the relevant voters (and their issues). Notice that 38 states are missing altogether:
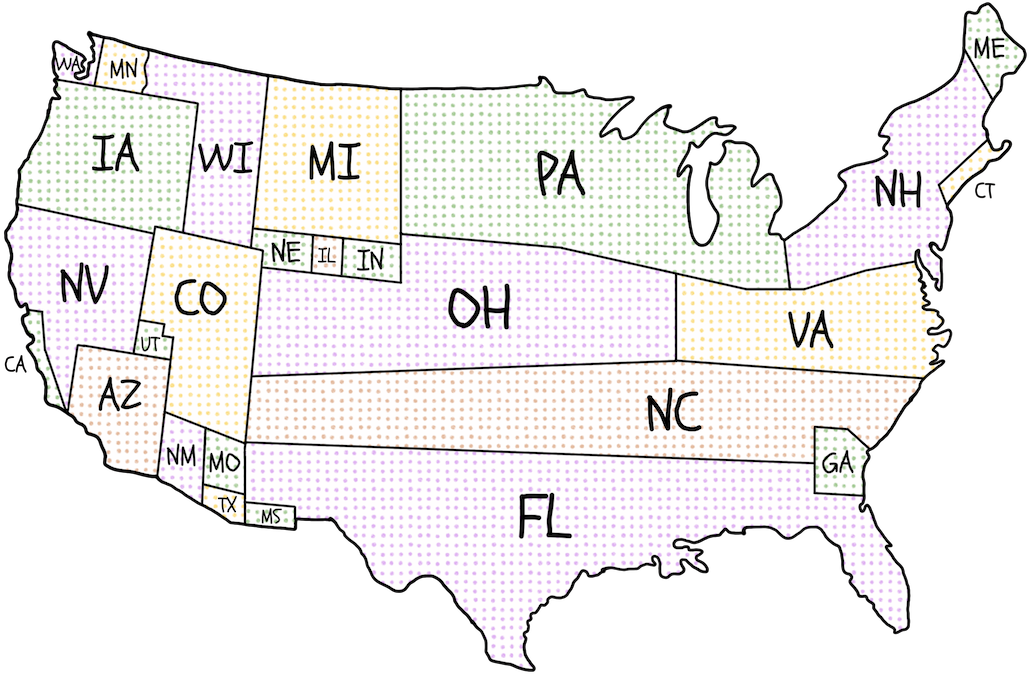
Similarly, in 2016, almost all campaign events (94%) were in the 12 states where Trump’s support was between 43% and 51%. Two-thirds of the events (273 of 399) were in just 6 states (OH, FL, VA, NC, PA, MI).
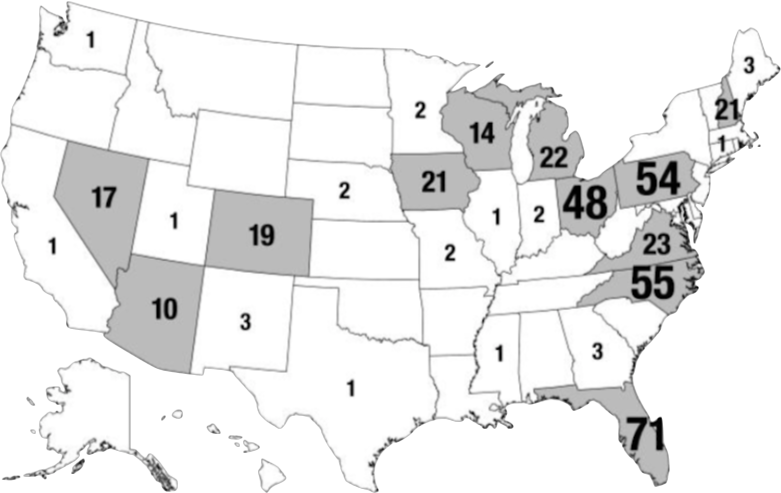
This is how the US map looks with state sizes based on the number of campaign events in 2016 (missing states received no campaign events):
State winner-take-all statutes adversely affect governance. “Battleground” states receive 7% more federal grants than “spectator” states, twice as many presidential disaster declarations, more Superfund enforcement exemptions, and more No Child Left Behind law exemptions.
Also, because of state winner-take-all statutes, five of our 45 Presidents have come into office without having won the most popular votes nationwide. The 2000 and 2016 elections are the most recent examples of elections in which a second-place candidate won the White House. Near-misses are also common under the current state-by-state winner-take-all method of awarding electoral votes. A shift of 59,393 votes in Ohio in 2004 would have elected John Kerry despite President Bush’s nationwide lead of over 3,000,000 votes.
The U.S. Constitution (Article II, Section 1) gives the states exclusive control over awarding their electoral votes: “Each State shall appoint, in such Manner as the Legislature thereof may direct, a Number of Electors….” The winner-take-all method of awarding electoral votes is state law. It is not in the U.S. Constitution. The winner-take-all rule was used by only three states in 1789, and all three repealed it by 1800. It was not until the 11th presidential election (1828) that even half the states used winner-take-all laws.
The National Popular Vote interstate compact will go into effect when enacted by states possessing a majority of the electoral votes—that is, enough to elect a President (270 of 538). At that time, every voter in the country will acquire a direct vote for a group of at least 270 presidential electors supporting their choice for President. All of this group of 270+ presidential electors will be supporters of the candidate who received the most popular votes in all 50 states and DC—thus making that candidate President.
In contrast, under the current system, a voter has a direct voice in electing only the small number of presidential electors to which their state is entitled. Under NPV, every voter directly elects 270+ electors.
Click here for a detailed explanation of each sentence in the National Popular Vote Interstate Compact Bill.
Additional information is available in the book Every Vote Equal: A State-Based Plan for Electing the President by National Popular Vote and at www.NationalPopularVote.com.
Learn More
Click on any of the topics below to learn more. You can also read about the numerous myths.
- Today, 48 states (all except Maine and Nebraska) have a so-called “winner-take-all” law that awards all of a state’s electors to the presidential candidate who gets the most popular votes inside each separate state.
- These winner-take-all laws are state laws—they are not part of the U.S. Constitution. The winner-take-all method of choosing presidential electors was never debated by the 1787 Constitutional Convention or mentioned in the Federalist Papers.
- Only three states had winner-take-all laws in the first presidential election in 1789, and all three repealed them by 1800. In 1789, electors were chosen from congressional districts in Massachusetts, from special presidential-elector districts in Virginia, and by counties in Delaware. The Governor and his Council appointed the state’s presidential electors in New Jersey. State legislatures appointed presidential electors in the other states.
- In the nation’s first competitive presidential election in 1796, Jefferson lost the Presidency by three electoral votes because presidential electors were chosen by district in the heavily Jeffersonian states of Virginia and North Carolina, and Jefferson lost one district in each state.
- On January 12, 1800, Thomas Jefferson wrote James Monroe (then governor of Virginia):
“On the subject of an election by a general ticket [winner-take-all], or by districts, … all agree that an election by districts would be best, if it could be general;but while 10 states choose either by their legislatures or by a general ticket [winner-take-all],it is folly and worse than follyfor the other 6 not to do it.”
- As a result, Virginia quickly passed a winner-take-all law in time for the 1800 election—thereby assuring Jefferson of all the state’s electoral votes.
- Meanwhile, the Federalist majority in the legislature of John Adam’s home state of Massachusetts—alarmed by rising support for Jefferson in the state—repealed the state’s district system—thereby assuring John Adams of all the state’s electoral votes in 1800.
- This triggered a domino effect in which each state’s dominant political party adopted winner-take-all so that it could deliver the maximum number of electoral votes to its party’s nominee. Ten states enacted winner-take-all by 1824 when Missouri Senator Thomas Hart Benton said:
now existing in 10 States was … not [the offspring] of any disposition to give fair play to the will of the people. It was adopted by the leading men of those states, to enable them to consolidate the vote of the State.”
- By 1836, all but one state had enacted laws specifying that their state’s voters would vote for presidential electors on a winner-take-all basis. By 1880, all states were using this system.
- In 1888, incumbent Democratic President Cleveland won the national popular vote, but lost the electoral vote. When Democrats won control of the legislature in the then-regularly-Republican state of Michigan in 1890, they replaced winner-take-all with district election of presidential electors. The Republicans challenged the Democrat’s change. In 1892, the U.S. Supreme Court upheld district elections and ruled in McPherson v. Blacker:
“The constitution does not provide that the appointment of electors shall be by popular vote, nor that the electors shall be voted for upon a general ticket [i.e., the winner-take-all rule], nor that the majority of those who exercise the elective franchise can alone choose the electors. … In short, the appointment and mode of appointment of electors belong exclusively to the states under the constitution of the United States.”
- The Republicans restored winner-take-all in Michigan as soon as they regained control of the state legislature.
- Maine adopted district elections for its electors in 1969, and Nebraska did so in 1992.
- Massachusetts has changed its method of appointing electors 11 times.
Contrary to what some may think, the current state-by-state winner-take-all method of awarding electoral votes decreases the political clout of small states in presidential elections.
- The eight smallest states (i.e., those with three electoral votes, including DC) together received only one of the nation’s 952 general-election campaign events in the 2008, 2012, and 2016 elections. In contrast, the closely divided battleground state of Wisconsin (with about the same population as the eight smallest states) received 40 events. Wisconsin received more attention despite having only 10 electoral votes—compared to 24 electoral votes for the eight states.
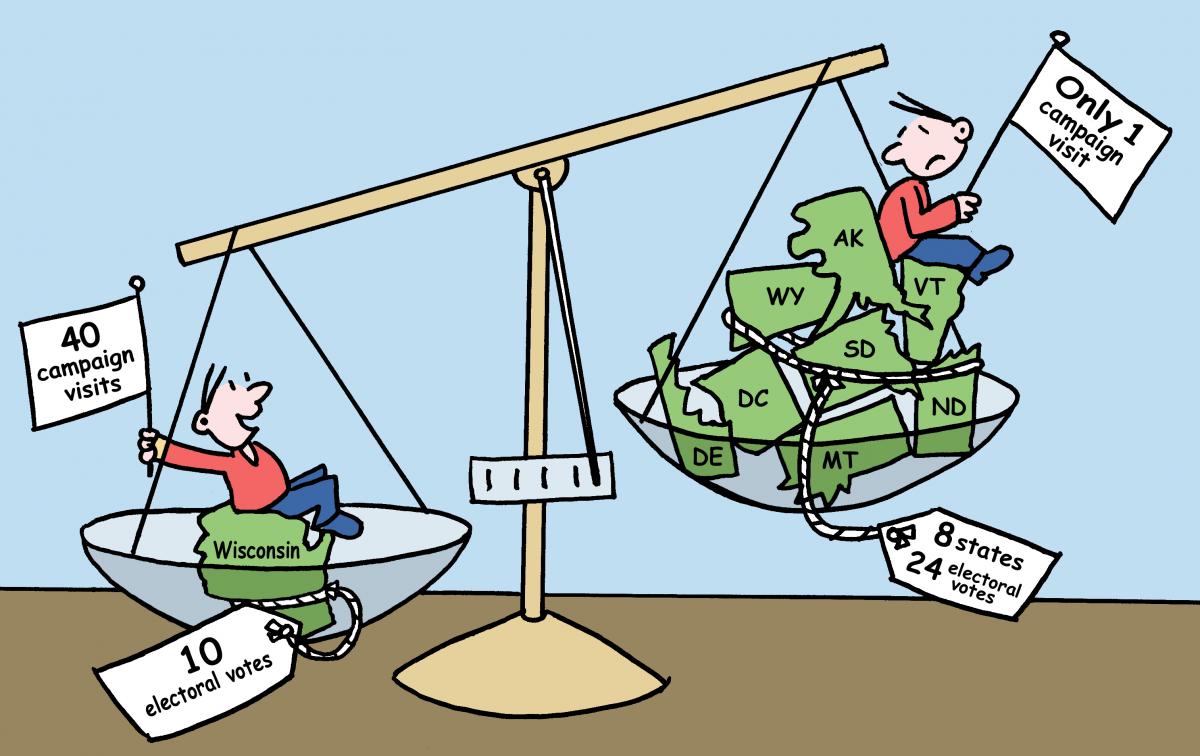
- Presidential candidates ignore the smallest states—not because they are small—but because they are one-party states in presidential elections. Under the current state-by-state winner-take-all method of awarding electoral votes political power comes from being a closely divided battleground state.
- The 13 smallest states (i.e., those with three or four electoral votes, including DC) are not predominantly Republican in presidential elections. In fact, these 13 jurisdictions have split 7-to-6 (or 8-to-5) in favor of the Democrats in all but one presidential election since 1992 (and 6-to-7 Republicans once).
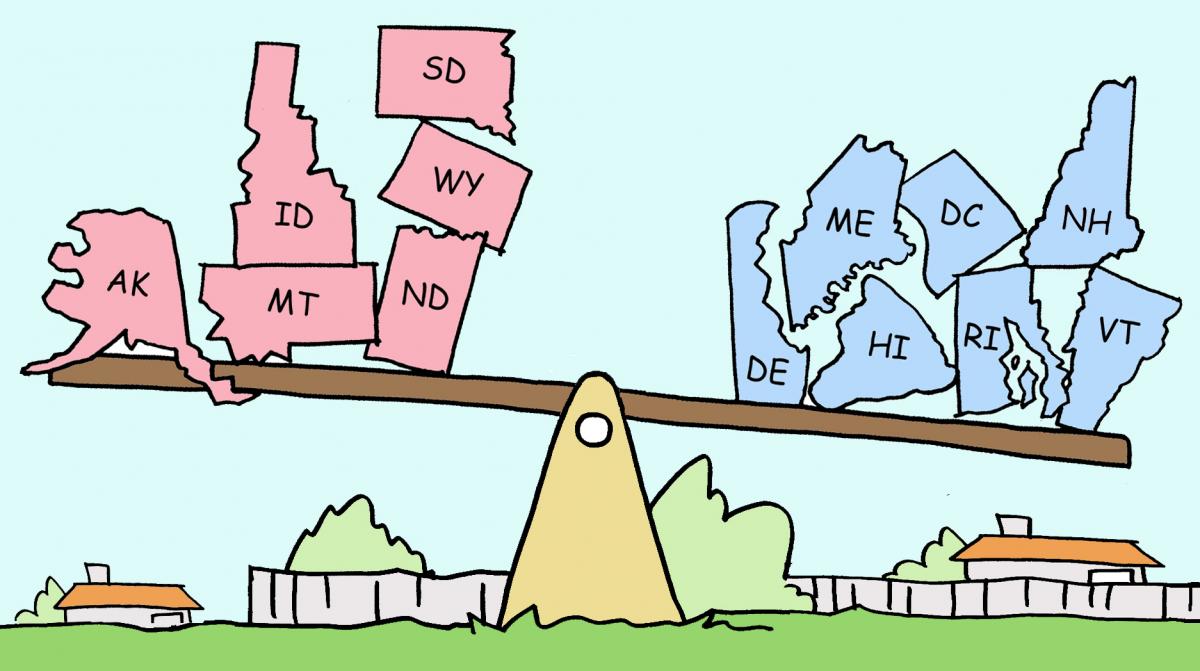
- President Trump did not win the Electoral College in 2016 because of small states. All of the 13 smallest states gave their electoral votes to the same party in 2016, 2012, 2008, and 2004 (except for President Trump receiving one electoral vote in Maine by winning its 2nd congressional district). Even if the 25 smallest states are considered, Iowa was the only state to switch parties between 2012 and 2016, and Iowa’s six electoral votes alone did not elect Trump.
- The fact that the small states are disadvantaged by the current state-by-state winner-take-all system has been long recognized by prominent officials from these states. In 1966, Delaware led a group of 12 predominantly small states in an effort to get state winner-take-all laws declared unconstitutional.
- Another indication that small states do not benefit from the current system is that Delaware, Hawaii, Rhode Island, Vermont, and the District of Columbia are among the 16 jurisdictions that have enacted the National Popular Vote interstate compact into law.
- The current state-by-state winner-take-all system actually shifts power from small and medium-sized states to an accidental handful of closely divided battleground states.
- A nationwide vote for President offers a way for small states to become relevant in presidential elections by making every one of their voters count directly toward the presidential candidate of their choice.
For more details, see this memo and read about the small state myths.
How would candidates campaign in a nationwide election for President in which every vote is equal and the winner is the candidate receiving the most popular votes throughout the entire United States?
Some people have speculated that a national popular vote for President would cause campaigns to concentrate disproportionately on heavily populated metropolitan areas and ignore rural areas.
However, there is no need to speculate about whether candidates would do this.
If there were any tendency for candidates to overemphasize big cities or ignore rural areas, we would see evidence of that tendency in the way campaigns are actually conducted today in the dozen or so closely divided “battleground” states where presidential campaigns take place.
Here are the facts as to how candidates actually campaigned for the votes of the 95 million people living inside the dozen closely divided battleground states:
- The biggest metro areas of the battleground states actually received a combined total of 191 general-election campaign visits— compared to 188 if visits had been based strictly on population.
- The areas outside each state’s biggest metro area received 427 visits— compared to 430 if visits had been based strictly on population.
In other words, real-world candidates hew closely to population when allocating campaign visits within battleground states—indeed they did so with almost surgical precision. Presidential candidates—advised by the nation’s most astute political strategists—campaign in this manner because every vote inside a battleground state is equal, and because the candidate receiving the most popular votes inside the state wins everything. There is no evidence that big metro areas exert any magnetic or intoxicating attraction causing candidates to concentrate disproportionately on heavily populated metropolitan areas or ignore rural areas.
For more details on how a nationwide presidential campaign would be run, see this memo.
Large cities will not dominate a national popular vote – they are simply not as large as some people think compared to the entire population of the country:
- The biggest 100 cities contain just one-sixth of the U.S. population (16%), and they voted 63% Democratic in 2004.
- The rural areas (i.e., places outside the nation’s Metropolitan Statistical Areas) contain one-sixth of the U.S. population, and they voted 60% Republican in 2004. That is, the biggest cities are almost exactly balanced out by rural areas in terms of population and partisan composition.
- The remaining two thirds of the U.S. population live inside a Metropolitan Statistical Area (MSA), but outside the central city. These suburban areas are evenly divided politically.
You can read more about the myths of big cities. As was discussed in the previous section, a close analogy for a national campaign is studying presidential campaigns in battleground states, where they do indeed campaign in cities, suburban and rural areas. While rural areas have lower population density, advertising and campaigning costs in those areas tend to be significantly lower than urban areas. The candidates need to win votes in all those areas to succeed overall.
Here are the number of general-election presidential campaign events (between the party convention and the general election) by state for the 2008, 2012 and 2016 elections:
| Electoral votes | State | 2008 events | 2012 events | 2016 events |
| 9 | Alabama | |||
| 3 | Alaska | |||
| 11 | Arizona | 10 | ||
| 6 | Arkansas | |||
| 55 | California | 1 | ||
| 9 | Colorado | 20 | 23 | 19 |
| 7 | Connecticut | 1 | ||
| 3 | D.C. | 1 | ||
| 3 | Delaware | |||
| 29 | Florida | 46 | 40 | 71 |
| 16 | Georgia | 3 | ||
| 4 | Hawaii | |||
| 4 | Idaho | |||
| 20 | Illinois | 1 | ||
| 11 | Indiana | 9 | 2 | |
| 6 | Iowa | 7 | 27 | 21 |
| 6 | Kansas | |||
| 8 | Kentucky | |||
| 8 | Louisiana | |||
| 4 | Maine | 2 | 3 | |
| 10 | Maryland | |||
| 11 | Massachusetts | |||
| 16 | Michigan | 10 | 1 | 22 |
| 10 | Minnesota | 2 | 1 | 2 |
| 6 | Mississippi | 1 | ||
| 10 | Missouri | 21 | 2 | |
| 3 | Montana | |||
| 5 | Nebraska | 2 | ||
| 6 | Nevada | 12 | 13 | 17 |
| 4 | New Hampshire | 12 | 13 | 21 |
| 14 | New Jersey | |||
| 5 | New Mexico | 8 | 3 | |
| 29 | New York | |||
| 15 | North Carolina | 15 | 3 | 55 |
| 3 | North Dakota | |||
| 18 | Ohio | 62 | 73 | 48 |
| 7 | Oklahoma | |||
| 7 | Oregon | |||
| 20 | Pennsylvania | 40 | 5 | 54 |
| 4 | Rhode Island | |||
| 9 | South Carolina | |||
| 3 | South Dakota | |||
| 11 | Tennessee | 1 | ||
| 38 | Texas | 1 | ||
| 6 | Utah | 1 | ||
| 3 | Vermont | |||
| 13 | Virginia | 23 | 36 | 23 |
| 12 | Washington | 1 | ||
| 5 | West Virginia | 1 | ||
| 10 | Wisconsin | 8 | 18 | 14 |
| 3 | Wyoming | |||
| 538 | Total | 300 | 253 | 399 |
- In 2008, only 3 of the 13 smallest states (3 or 4 electoral votes) received any of the 300 general-election campaign events. The closely divided battleground state of New Hampshire received 12 events. Maine (which awards electoral votes by congressional district) received 2 events. The District of Columbia received one event. All the other states in this group were ignored. The small states are ignored not because they are small, but because (except for New Hampshire), they are one-party states in presidential elections.
- In 2008, only 7 of the 25 smallest states (7 or fewer electoral votes) received any of the general-election campaign events. New Hampshire, Iowa, and Nevada each received a substantial number of events (12, 7, and 12, respectively). New Mexico (a battleground state at the time) received 8 events. West Virginia and the District of Columbia received 1 event each. All the other small states in this group were ignored.
- In 2012, only 1 of the 13 smallest states (3 or 4 electoral votes) received any of the 253 general-election campaign events, namely the closely divided battleground state of New Hampshire. All the other states in this group were ignored.
- In 2012, only 3 of the 25 smallest states (7 or fewer electoral votes) received any of the general-election campaign events. All the other small states were ignored. The 3 states that received attention were the closely divided battleground states of New Hampshire, Iowa, and Nevada. All the other states in this group were ignored.
- In 2016, only 2 of the 13 smallest states (3 or 4 electoral votes) received any of the 399 general-election campaign events. New Hampshire received 21 because it was a closely divided battleground state. Maine (which awards electoral votes by congressional district) received 3 campaign events because its 2nd congressional district was closely divided (and, indeed, Trump carried it). All the other states in this group were ignored.
- In 2016, only 9 of the 25 smallest states (7 or fewer electoral votes) received any general-election campaign events. New Hampshire, Iowa, and Nevada received attention because they were closely divided battleground states. Maine and Nebraska (which award electoral votes by congressional district) received some attention, since one of their congressional districts was closely divided. New Mexico received some attention (from the Republican campaign only) because former New Mexico Governor Johnson was running for President and it appeared his strong home-state support might make the state competitive. Utah received some attention from Republicans because the McMullin candidacy might have made the state competitive. Connecticut and Mississippi also received one campaign event. All the other small states in this group were ignored.
Another way to look at why states are ignored in presidential elections is to see which states consistently vote for one party or the other. This table shows that 16 states voted Democratic and 22 states voted Republican in all five presidential elections from 2000–2016. Because of the winner-take-all approach that states use to assign their electoral votes, these states, plus some of the others, are almost certain to deliver all their electoral votes to one candidate or the other, and therefore are ignored by the candidates.
|
Dem 5/5 16 states |
Dem 4/5 5 states |
Dem 3/5 4 states |
Dem 2/5 2 states |
Dem 1/5 2 states |
Dem 0/5 22 states |
| CA (55) | MI (16) | VA (13) | FL (29) | IN (11) | AL (9) |
| CT (7) | NH (4) | CO (9) | OH (18) | NC (15) | AK (3) |
| DE (3) | NM (5) | NV (6) | AR (6) | ||
| DC (3) | PA (20) | IA (6) | AZ (11) | ||
| HI (4) | WI (10) | GA (16) | |||
| IL (20) | ID (4) | ||||
| MA (11) | KS (6) | ||||
| ME (4) | KY (8) | ||||
| MD (10) | LA (8) | ||||
| MN (10) | MO (10) | ||||
| NJ (14) | MS (6) | ||||
| NY (29) | MT (3) | ||||
| OR (7) | NE (5) | ||||
| RI (4) | ND (3) | ||||
| VT (3) | OK (7) | ||||
| WA (12) | SC (9) | ||||
| SD (3) | |||||
| TN (11) | |||||
| TX (38) | |||||
| UT (6) | |||||
| WY (3) | |||||
| WV (5) | |||||
| 196 EV | 55 EV | 34 EV | 47 EV | 26 EV | 180 EV |
Note: The number of electoral votes shown are for 2012, 2016, and 2020 elections. DC is counted as a state for purposes of this chart.
The states are listed below in order of Romney’s 2012 percentage—with the most Republican (red) states at the top. All of the 253 General-Election Campaign Events in 2012 occurred in states where Romney’s percentage of the two-party vote was between 45% and 51%.
The second column shows the total number of general-election campaign events for each state (out of a nationwide total of 253).
The only states that received any campaign events (second column) and any significant ad money (third column) were the 12 states (shown in black in the middle of the table) where the Romney received between 45% and 51% of the vote—that is, within 3 points of his nationwide percentage of 48%. Only 8 states received more than a handful of campaign events.
Only 1 of the 13 smallest states (with 3 or 4 electoral votes) received any of the 253 general-election campaign events, namely the closely divided battleground state of New Hampshire. All the other states in this group were ignored. Only 3 of the 25 smallest states (with 7 or fewer electoral votes) received any of the general-election campaign events. All the other small states were ignored. The 3 states that received attention were the closely divided battleground states of New Hampshire, Iowa, and Nevada.
The fourth column in the table shows donations from each state (scroll the table left to see all the columns).
| Romney Percent | Campaign events | TV ad spending | Donations | State | Romney (R) | Obama (D) | R-Margin | D-Margin | R-EV | D-EV | |
| 75% | 0 | $0 | $11,230,092 | Utah | 740,600 | 251,813 | 488,787 | 6 | |||
| 71% | 0 | $0 | $2,225,204 | Wyoming | 170,962 | 69,286 | 101,676 | 3 | |||
| 67% | 0 | $1,300 | $7,129,393 | Oklahoma | 891,325 | 443,547 | 447,778 | 7 | |||
| 66% | 0 | $290 | $3,586,883 | Idaho | 420,911 | 212,787 | 208,124 | 4 | |||
| 64% | 0 | $100 | $1,985,666 | WV | 417,584 | 238,230 | 179,354 | 5 | |||
| 62% | 0 | $0 | $3,296,533 | Arkansas | 647,744 | 394,409 | 253,335 | 6 | |||
| 62% | 0 | $400 | $6,079,673 | Kentucky | 1,087,190 | 679,370 | 407,820 | 8 | |||
| 61% | 0 | $80 | $6,736,196 | Alabama | 1,255,925 | 795,696 | 460,229 | 9 | |||
| 61% | 0 | $0 | $4,796,947 | Kansas | 692,634 | 440,726 | 251,908 | 6 | |||
| 61% | 0 | $0 | $3,128,691 | Nebraska | 475,064 | 302,081 | 172,983 | 5 | |||
| 60% | 0 | $346,490 | $844,129 | ND | 188,320 | 124,966 | 63,354 | 3 | |||
| 60% | 0 | $1,440 | $11,967,542 | Tennessee | 1,462,330 | 960,709 | 501,621 | 11 | |||
| 59% | 0 | $3,990 | $7,510,687 | Louisiana | 1,152,262 | 809,141 | 343,121 | 8 | |||
| 59% | 0 | $1,810 | $1,267,192 | SD | 210,610 | 145,039 | 65,571 | 3 | |||
| 58% | 0 | $2,570 | $64,044,620 | Texas | 4,569,843 | 3,308,124 | 1,261,719 | 38 | |||
| 57% | 0 | $0 | $2,153,869 | Alaska | 164,676 | 122,640 | 42,036 | 3 | |||
| 57% | 0 | $0 | $2,295,005 | Montana | 267,928 | 201,839 | 66,089 | 3 | |||
| 56% | 0 | $0 | $3,525,145 | Mississippi | 710,746 | 562,949 | 147,797 | 6 | |||
| 55% | 0 | $40,350 | $14,631,204 | Arizona | 1,233,654 | 1,025,232 | 208,422 | 11 | |||
| 55% | 0 | $300 | $8,210,564 | Indiana | 1,420,543 | 1,152,887 | 267,656 | 11 | |||
| 55% | 0 | $127,560 | $11,512,255 | Missouri | 1,482,440 | 1,223,796 | 258,644 | 10 | |||
| 55% | 0 | $710 | $6,686,788 | SC | 1,071,645 | 865,941 | 205,704 | 9 | |||
| 54% | 0 | $6,020 | $21,906,923 | Georgia | 2,078,688 | 1,773,827 | 304,861 | 16 | |||
| 51% | 3 | $80,000,000 | $18,658,894 | NC | 2,270,395 | 2,178,391 | 92,004 | 15 | |||
| 50% | 40 | $175,776,780 | $56,863,167 | Florida | 4,162,341 | 4,235,965 | 73,624 | 29 | |||
| 48% | 73 | $148,000,000 | $20,654,423 | Ohio | 2,661,407 | 2,827,621 | 166,214 | 18 | |||
| 48% | 36 | $127,000,000 | $32,428,002 | Virginia | 1,822,522 | 1,971,820 | 149,298 | 13 | |||
| 47% | 23 | $71,000,000 | $20,695,557 | Colorado | 1,185,050 | 1,322,998 | 137,948 | 9 | |||
| 47% | 27 | $52,194,330 | $4,780,400 | Iowa | 730,617 | 822,544 | 91,927 | 6 | |||
| 47% | 13 | $55,000,000 | $6,717,552 | Nevada | 463,567 | 531,373 | 67,806 | 6 | |||
| 47% | 13 | $34,000,000 | $4,389,577 | NH | 329,918 | 369,561 | 39,643 | 4 | |||
| 47% | 5 | $31,000,000 | $27,661,702 | Pennsylvania | 2,680,434 | 2,990,274 | 309,840 | 20 | |||
| 47% | 18 | $40,000,000 | $10,011,235 | Wisconsin | 1,410,966 | 1,620,985 | 210,019 | 10 | |||
| 46% | 1 | $0 | $11,112,922 | Minnesota | 1,320,225 | 1,546,167 | 225,942 | 10 | |||
| 45% | 1 | $15,186,750 | $19,917,206 | Michigan | 2,115,256 | 2,564,569 | 449,313 | 16 | |||
| 45% | 0 | $1,162,000 | $5,770,738 | New Mexico | 335,788 | 415,335 | 79,547 | 5 | |||
| 44% | 0 | $460 | $10,463,528 | Oregon | 754,175 | 970,488 | 216,313 | 7 | |||
| 42% | 0 | $195,610 | $3,452,126 | Maine | 292,276 | 401,306 | 109,030 | 4 | |||
| 42% | 0 | $0 | $23,600,404 | Washington | 1,290,670 | 1,755,396 | 464,726 | 12 | |||
| 41% | 0 | $330 | $18,644,901 | Connecticut | 634,892 | 905,083 | 270,191 | 7 | |||
| 41% | 0 | $0 | $2,141,203 | Delaware | 165,484 | 242,584 | 77,100 | 3 | |||
| 41% | 0 | $270 | $107,928,359 | Illinois | 2,135,216 | 3,019,512 | 884,296 | 20 | |||
| 41% | 0 | $0 | $24,062,220 | New Jersey | 1,478,088 | 2,122,786 | 644,698 | 14 | |||
| 38% | 0 | $320 | $137,804,736 | California | 4,839,958 | 7,854,285 | 3,014,327 | 55 | |||
| 38% | 0 | $0 | $35,927,766 | Mass | 1,188,314 | 1,921,290 | 732,976 | 11 | |||
| 37% | 0 | $1,120 | $25,579,933 | Maryland | 971,869 | 1,677,844 | 705,975 | 10 | |||
| 36% | 0 | $55,600 | $76,743,682 | New York | 2,485,432 | 4,471,871 | 1,986,439 | 29 | |||
| 36% | 0 | $0 | $2,226,963 | Rhode Island | 157,204 | 279,677 | 122,473 | 4 | |||
| 32% | 0 | $0 | $2,732,572 | Vermont | 92,698 | 199,239 | 106,541 | 3 | |||
| 28% | 0 | $0 | $3,217,863 | Hawaii | 121,015 | 306,658 | 185,643 | 4 | |||
| 7% | 0 | $0 | $16,670,938 | DC | 21,381 | 267,070 | 245,689 | 3 | |||
| 48.0% | 253 | $831,106,980 | $937,609,770 | Total | 60,930,782 | 65,897,727 | 206 | 332 |
http://archive3.fairvote.org/research-and-analysis/presidential-elections/2012chart
In 2016, there were 399 general-election campaign events. Almost all campaign events (94%) were in the 12 states where Trump’s support was between 47% and 55% of the two-party vote. Two-thirds of the events (273 of 399) were in just 6 states (OH, FL, VA, NC, PA, MI).
12 battleground states in 2016 accounting for 94% of the campaign events (375 of 399)
| Trump % | Events | State | Trump | Clinton | R-Margin | D-Margin | R-EV | D-EV | Population |
| 55% | 21 | Iowa | 800,983 | 653,669 | 147,314 | 6 | 3,053,787 | ||
| 54% | 48 | Ohio | 2,841,006 | 2,394,169 | 446,837 | 18 | 11,568,495 | ||
| 52% | 55 | North Carolina | 2,362,631 | 2,189,316 | 173,315 | 15 | 9,565,781 | ||
| 52% | 10 | Arizona | 1,252,401 | 1,161,167 | 91,234 | 11 | 6,412,700 | ||
| 51% | 71 | Florida | 4,617,886 | 4,504,975 | 112,911 | 29 | 18,900,773 | ||
| 50% | 14 | Wisconsin | 1,405,284 | 1,382,536 | 22,748 | 10 | 5,698,230 | ||
| 50% | 54 | Pennsylvania | 2,970,733 | 2,926,441 | 44,292 | 20 | 12,734,905 | ||
| 50% | 22 | Michigan | 2,279,543 | 2,268,839 | 10,704 | 16 | 9,911,626 | ||
| 49.8% | 21 | New Hampshire | 345,790 | 348,526 | 2,736 | 4 | 1,321,445 | ||
| 49% | 17 | Nevada | 512,058 | 539,260 | 27,202 | 6 | 2,709,432 | ||
| 47% | 19 | Colorado | 1,202,484 | 1,338,870 | 136,386 | 9 | 5,044,930 | ||
| 47% | 23 | Virginia | 1,769,443 | 1,981,473 | 212,030 | 13 | 8,037,736 | ||
| 51% | 375 | 22,360,242 | 21,689,241 | 125 | 32 | 94,959,840 |
Notes: (1) Trump percentage is of the two-party vote (2) Population is from 2010 census.
Only 2 of the 13 smallest states (with 3 or 4 electoral votes) received any of the 399 general-election campaign events. New Hampshire received 21 because it was a closely divided battleground state. Maine (which awards electoral votes by congressional district) received 3 campaign events because its 2nd congressional district was closely divided (and, indeed, Trump carried it). All the other states in this group were ignored.
Only 9 of the 25 smallest states (with 7 or fewer electoral votes) received any general-election campaign events. New Hampshire, Iowa, and Nevada received attention because they were closely divided battleground states. Maine and Nebraska (which award electoral votes by congressional district) received some attention since just one of their congressional districts was closely divided. New Mexico received some attention (from the Republican campaign only) because former New Mexico Governor Johnson was running for President and it appeared his strong home-state support might make the state competitive. Utah received some attention from Republicans because the McMullin candidacy might have made the state competitive. Connecticut and Mississippi also received one campaign event. All the other small states in this group were ignored.
39 spectator states in 2016 accounting for 6% of the campaign events (24 of 399)
| Trump % | Events | State | Trump | Clinton | R-Margin | D-Margin | R-EV | D-EV | Population |
| 76% | 0 | Wyoming | 174,419 | 55,973 | 118,446 | 3 | 568,300 | ||
| 72% | 0 | West Virginia | 489,371 | 188,794 | 300,577 | 5 | 1,859,815 | ||
| 70% | 0 | North Dakota | 216,794 | 93,758 | 123,036 | 3 | 675,905 | ||
| 69% | 0 | Oklahoma | 949,136 | 420,375 | 528,761 | 7 | 3,764,882 | ||
| 68% | 0 | Idaho | 409,055 | 189,765 | 219,290 | 4 | 1,573,499 | ||
| 66% | 0 | South Dakota | 227,721 | 117,458 | 110,263 | 3 | 819,761 | ||
| 66% | 0 | Kentucky | 1,202,971 | 628,854 | 574,117 | 8 | 4,350,606 | ||
| 64% | 0 | Alabama | 1,318,255 | 729,547 | 588,708 | 9 | 4,802,982 | ||
| 64% | 0 | Arkansas | 684,872 | 380,494 | 304,378 | 6 | 2,926,229 | ||
| 64% | 0 | Tennessee | 1,522,925 | 870,695 | 652,230 | 11 | 6,375,431 | ||
| 64% | 2 | Nebraska | 495,961 | 284,494 | 211,467 | 5 | 1,831,825 | ||
| 62% | 1 | Utah | 515,231 | 310,676 | 204,555 | 6 | 2,770,765 | ||
| 61% | 0 | Kansas | 671,018 | 427,005 | 244,013 | 6 | 2,863,813 | ||
| 61% | 0 | Montana | 279,240 | 177,709 | 101,531 | 3 | 994,416 | ||
| 60% | 0 | Louisiana | 1,178,638 | 780,154 | 398,484 | 8 | 4,553,962 | ||
| 60% | 2 | Indiana | 1,557,286 | 1,033,126 | 524,160 | 11 | 6,501,582 | ||
| 60% | 2 | Missouri | 1,594,511 | 1,071,068 | 523,443 | 10 | 6,011,478 | ||
| 59% | 1 | Mississippi | 700,714 | 485,131 | 215,583 | 6 | 2,978,240 | ||
| 58% | 0 | Alaska | 163,387 | 116,454 | 46,933 | 3 | 721,523 | ||
| 57% | 0 | South Carolina | 1,155,389 | 855,373 | 300,016 | 9 | 4,645,975 | ||
| 55% | 1 | Texas | 4,685,047 | 3,877,868 | 807,179 | 38 | 25,268,418 | ||
| 53% | 3 | Georgia | 2,089,104 | 1,877,963 | 211,141 | 16 | 9,727,566 | ||
| 49% | 2 | Minnesota | 1,323,232 | 1,367,825 | 44,593 | 10 | 5,314,879 | ||
| 48% | 3 | Maine | 335,593 | 357,735 | 22,142 | 1 | 3 | 1,333,074 | |
| 45% | 3 | New Mexico | 319,667 | 385,234 | 65,567 | 5 | 2,067,273 | ||
| 44% | 0 | Delaware | 185,127 | 235,603 | 50,476 | 3 | 900,877 | ||
| 44% | 0 | Oregon | 782,403 | 1,002,106 | 219,703 | 7 | 3,848,606 | ||
| 43% | 1 | Connecticut | 673,215 | 897,572 | 224,357 | 7 | 3,581,628 | ||
| 43% | 0 | New Jersey | 1,601,933 | 2,148,278 | 546,345 | 14 | 8,807,501 | ||
| 42% | 0 | Rhode Island | 180,543 | 252,525 | 71,982 | 4 | 1,055,247 | ||
| 41% | 1 | Washington | 1,221,747 | 1,742,718 | 520,971 | 12 | 6,753,369 | ||
| 41% | 1 | Illinois | 2,146,015 | 3,090,729 | 944,714 | 20 | 12,864,380 | ||
| 38% | 0 | New York | 2,819,557 | 4,556,142 | 1,736,585 | 29 | 19,421,055 | ||
| 36% | 0 | Maryland | 943,169 | 1,677,928 | 734,759 | 10 | 5,789,929 | ||
| 35% | 0 | Massachusetts | 1,090,893 | 1,995,196 | 904,303 | 11 | 6,559,644 | ||
| 35% | 0 | Vermont | 95,369 | 178,573 | 83,204 | 3 | 630,337 | ||
| 34% | 1 | California | 4,483,814 | 8,753,792 | 4,269,978 | 55 | 37,341,989 | ||
| 33% | 0 | Hawaii | 128,847 | 266,891 | 138,044 | 4 | 1,366,862 | ||
| 4% | 0 | D.C. | 12,723 | 282,830 | 270,107 | 3 | 601,723 | ||
| 48% | 24 | 40,624,892 | 44,164,411 | 181 | 200 | 214,825,346 |
Notes: (1) Trump percentage is of the two-party vote (2) Population is from 2010 census.